Keith Matthews
I wear lots of hats, checkout these projects!
Project maintained by kmatthews123 Hosted on GitHub Pages — Theme by mattgraham
Development of an ansible playbook to update the systems in the microspace
Micro Space Ansible Setup
Goals
- Create inventory of devices present in the micro space in development and production clusters
- Run automated daily updates of development cluster of machines
- Run automated once a week updates of production machines
- Log information about updates
- notifications pushed to discord channel with stats on updates along with any required reboots of infrastructure
Code
Checkout the code associated with this project! https://github.com/kmatthews123/ansible
list of machines
Development
- dev-nas-1 (planned)
- dev-compute-1
- dev-compute-2
- dev-gpu-compute-1
Production
- prod-nas-1
- prod-playbook-runner-compute-1
- prod-compute-2
Network Devices
- mikrotik1
Steps to complete
- the following needs to be true on all machines
- I need to be able to login using ssh
- The machine needs to have the borg user
- the borg user needs the following
- No password sudo privileges
- ssh public keys for the machine that will run the ansible playbooks
- secure password (saved in Micro Space password vault)
- ssh daemon needs to be restarted to apply changes
- While I directly working on any device, I fixed any minor configuration issues having to do with my access. on some machines I had set all sudo group members have no password access. this was an artifact of early experimentation with ansible on my part and was insecure. These problems have been rectified.
Now that the machines are all functional and able to talk together development of the ansible playbooks can begin.
-
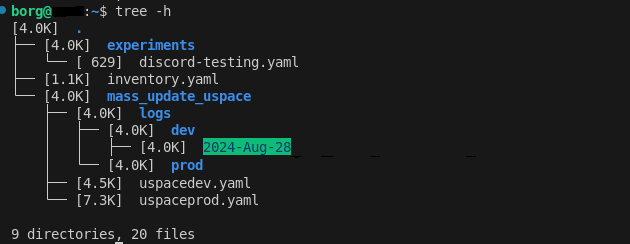
Decide on structure of file system for machine that will run ansible playbooks. that looks like this
- Develop Playbooks for development and production clusters. these will largely be the same but with different variables plugged in. They need to be two separate playbooks due to the different timelines each is run under. Cron jobs will be used to deploy playbooks on their schedules.
- Build/use standard plays to run updates on remote Linux systems
- get Cron jobs working
- Originally I was considering using a tool called semaphore UI primarily for the scheduling tools used to run ansible playbooks or other IAC tasks along with UI triggers and other things. this tool seems like the portainer of the ansible/terraform/opentofu world and while it looked neat and I will likely circle back to it at some point I decided that the management overhead for using this tool and getting it setup was more than I wanted to mess with at this point. Cron seems like plenty enough to run daily and weekly update/upgrade tasks. If I decide to move this all to semaphore-UI in the future there shouldn’t be a ton of additional work to make that happen.
- This was pretty straight forward. I followed a guide from phoenix systems to setup crontab. I set it up to run a simple playbook once every couple of minutes and was able to observe logs being generated.
- The server running the ansible playbooks is on UTC time so I set the Cron jobs to run at 10:00 UTC which is around 2-3 in the morning in the pacific timezone where these servers exist so the updates don’t interrupt others working in the micro space.
- The production machines will be at the same time but their Cron jobs will run on Sunday nights (this might change to Monday nights, need to talk with more experienced sys-admins about that)
Add Logging functionality
- the bulk of the playbooks to run these updates are tasks to properly complete the logging of the updates run on these servers.
- since all the servers run Debian the apt package manager was easy to setup and pull data from using the regex search function
- the playbooks register the output of the update step and the check if a reboot is required and starts to work with that data.
- create a folder for the day the update runs in either the dev or prod folder
- save a .log file to the local host with just the hostname number of upgraded, newly installed, removed, and held packages, and if the reboot_required file exists.
- save a .vlog file to the local host with the entire standard output from ansible with the results of the update command.
- register the .log files saved to the local host to work with them via ansible
- echo the log file contents into a single file
- convert the log file into a string
- other processes are engaged. more on them shortly. after those steps are done the .log files get deleted but the .vlog files stay for later review of what was updated on remote systems since those packages are named.
- It should be noted that the logging steps almost all happen on the machine that runs all the ansible playbooks. While not implemented, this will likely make it easy to ship these log files off to a NAS that can archive them or use them as data points for Grafana. that is out of the scope of this whole thing but will be worked on later.
Add notifications
- This was much more simple than I expected. Since the members of the micro space use discord for general communications I wanted to implement daily notifications of what systems got updated and how many updates got deployed along with the information on what servers are due for a reboot due to kernel updates.
- I setup a channel in the discord server and setup a simple webhook integration. copying over the link and then using the community.general.discord module allowed me to send the contents of the combined log file as an embedded message with all the info for all machines in the dev or production cluster. there is also some additional tweaks made to the simple webhook push to truncate the amount of characters (it seems there’s a limit of 1000 characters per message. this could be negated by building a discord bot but that is out of scope at this time.)
- This webhook solution kind of just works and didn’t need a ton in the way of configuration. the bulk of the challenge here was figuring out how to format the message and the logs in such a way that they were brief and to the point.
Get Open Media Vault working
- This was largely the same as running updates for everything else but with a few caveats
- the main one was that the open media vault machine, while it contains the apt package manager, really relies on the
omv-upgradetool to run all necessary updates from the CLI or in an automated fashion. there may be an API but I don’t think ansible has been regularly used with open media vault so I kinda had to figure this out on my own - What I figured out was that the
omv-upgradetool is used to upgrade the system and thenomv-salt deploy run --append-dirtyto apply the pending changes (that yellow banner that shows up at the top of the page any time you change something in open media vault) - I could possibly setup the OMV7 steps to reside inside the play to update the regular Linux hosts but that would have been much more invasive and would likely have required I test against real hosts which I’m trying to avoid with the production network as much as possible.
- development for this portion was done on my local network targeting an OMV7 virtual machine
Network devices
- I decided that with the progress other members of the micro space are making into logging with Grafana and specifically with that in conjunction with mikrotik devices, coupled with the fact that mikrotik devices are updated infrequently, I don’t think scheduled update and notification steps are necessary in the same way the Linux systems get daily package updates
- I do have updates of the mikrotik infrastructure using ansible working so I think that the workflow there will either be using Grafana to notify when updates are available for those pieces of infrastructure and then one of the admins responsible for that equipment will either just apply updates via the mikrotik dashboard or they can login to the ansible playbook machine and manually run the update playbooks. this will need to be a thing that is done with care because updating the mikrotik equipment brings down the network the Micro Space runs in for 5-10 minutes which is rude
Conclusion
I learned a lot with this lab. I think that in the future, while all the logging stuff was/is very cool and does work, using tools like Prometheus and Grafana make more sense for alerting and there is likely a way to use those tools and their functions to more effectively do the logging and messaging than what I built here. That being said, I am really proud of this set of playbooks and I think it taught me a lot of valuable information that I can go on to use with ansible in the future and I got a better Idea of the bigger devops picture that exists. The update portion of this task is working and it is something that could be tied into with other sorts of tools down the line. running ansible playbooks from a dashboard based on different alerts to various sysadmins is a thing that is coming to the micro space.